

Keywords:
Climate and environmental impacts at a global scale.
The planet is now deeply rooted in the Anthropocene [1], an era where human pressures are increasing and compromising the resilience of the Earth system [2]. Resolving the earth’s environmental problems must foster the idea of common responsibility between nations. An initial hurdle towards this shared vision, however, is the education of countries on their global impacts in terms of per capita consumption and the absolute planetary footprint of their countries.
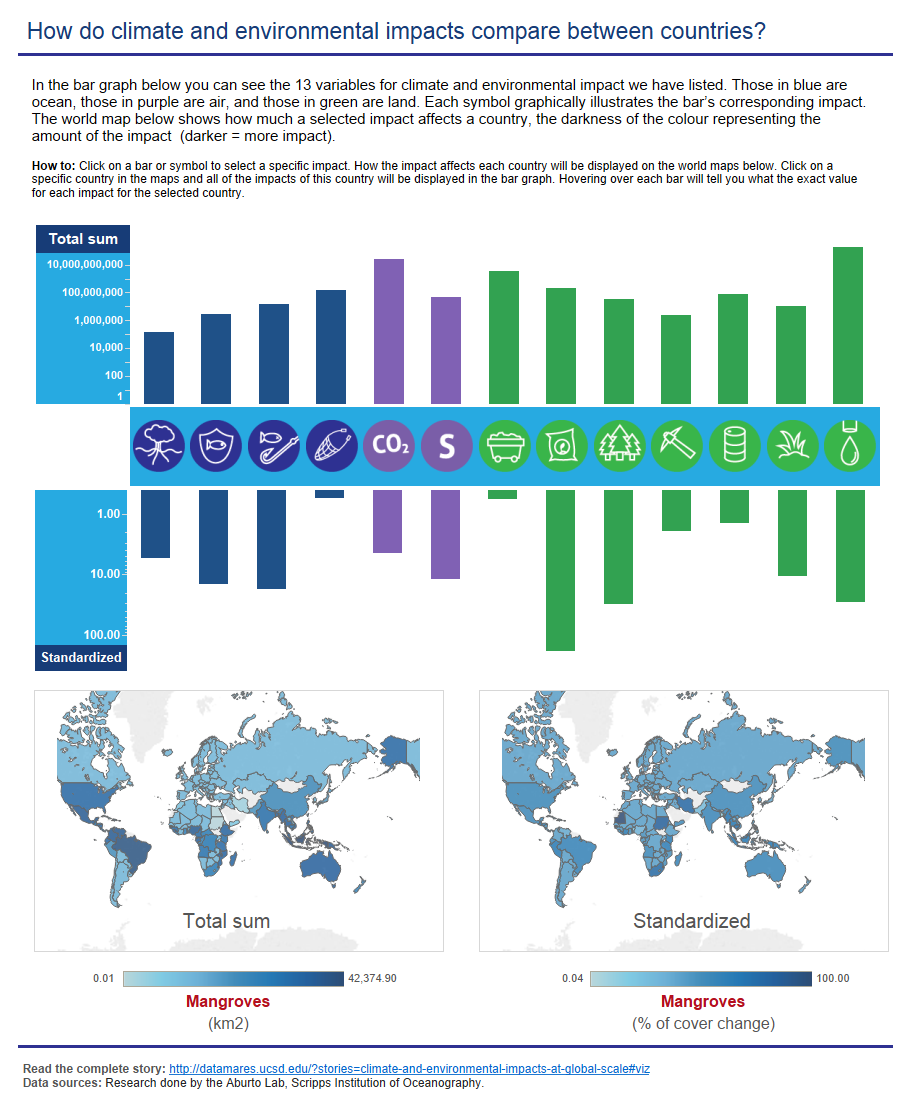
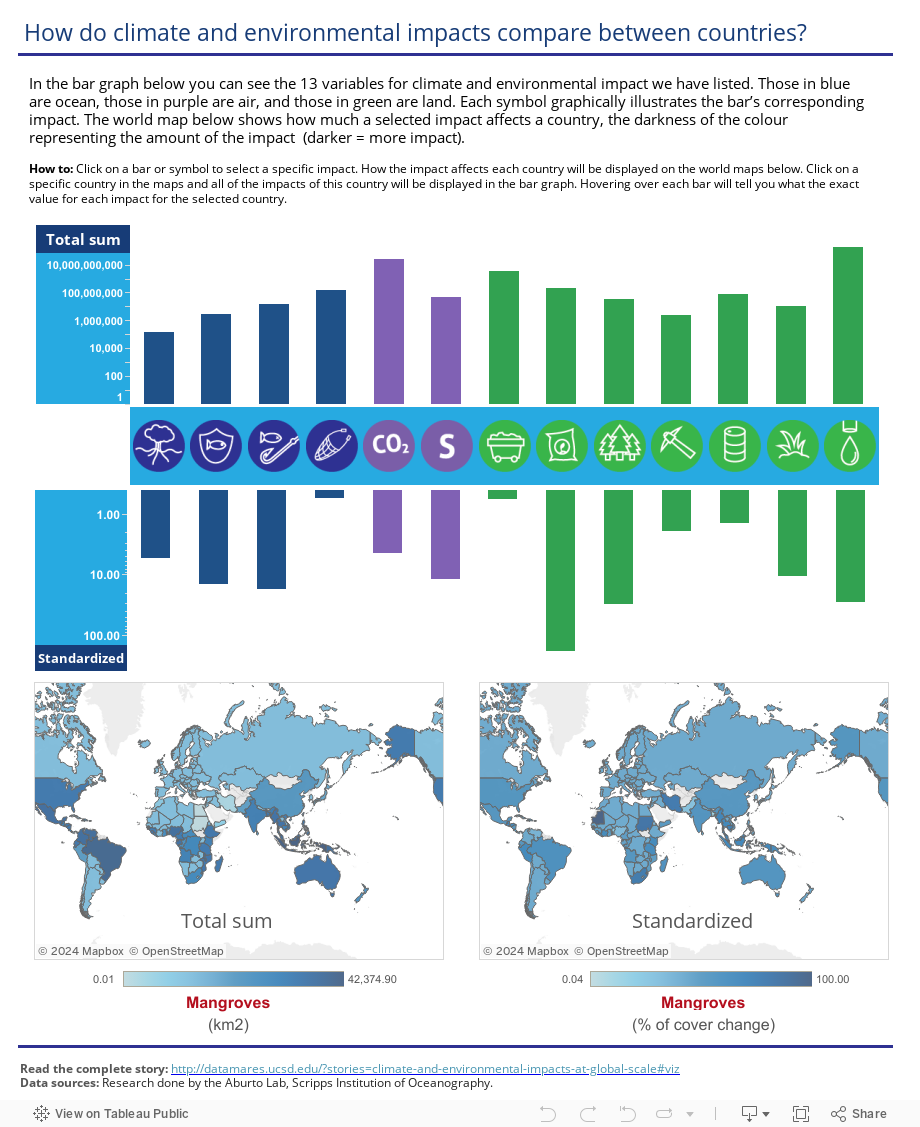
Here, we compile a set of 13 human-induced climate and environmental impacts from land, ocean and air, in order to highlight their per-country patterns. The impacts we have chosen are not exhaustive, but we believe these are the most influential in terms of overall ecosystem degradation. Considering the interconnectedness between land, ocean and air ecosystems and that many climate and environmental impacts do not work in isolation but in fact in concert (e.g. the effects of high CO2 emissions can be partially remediated with increased forest area), we include impacts that require reductions and those that require increases. In essence, those that have both negative and positive effects on planetary health.
In order to facilitate comparisons between countries for each impact, we gathered data as percentages of each impact variable per country (e.g. area of mangrove cover, fisheries overfished etc.). Additionally, in order to show the current impacts over a global scale, we calculated the absolute amount of each environmental impact produced for each country.
Major findings:
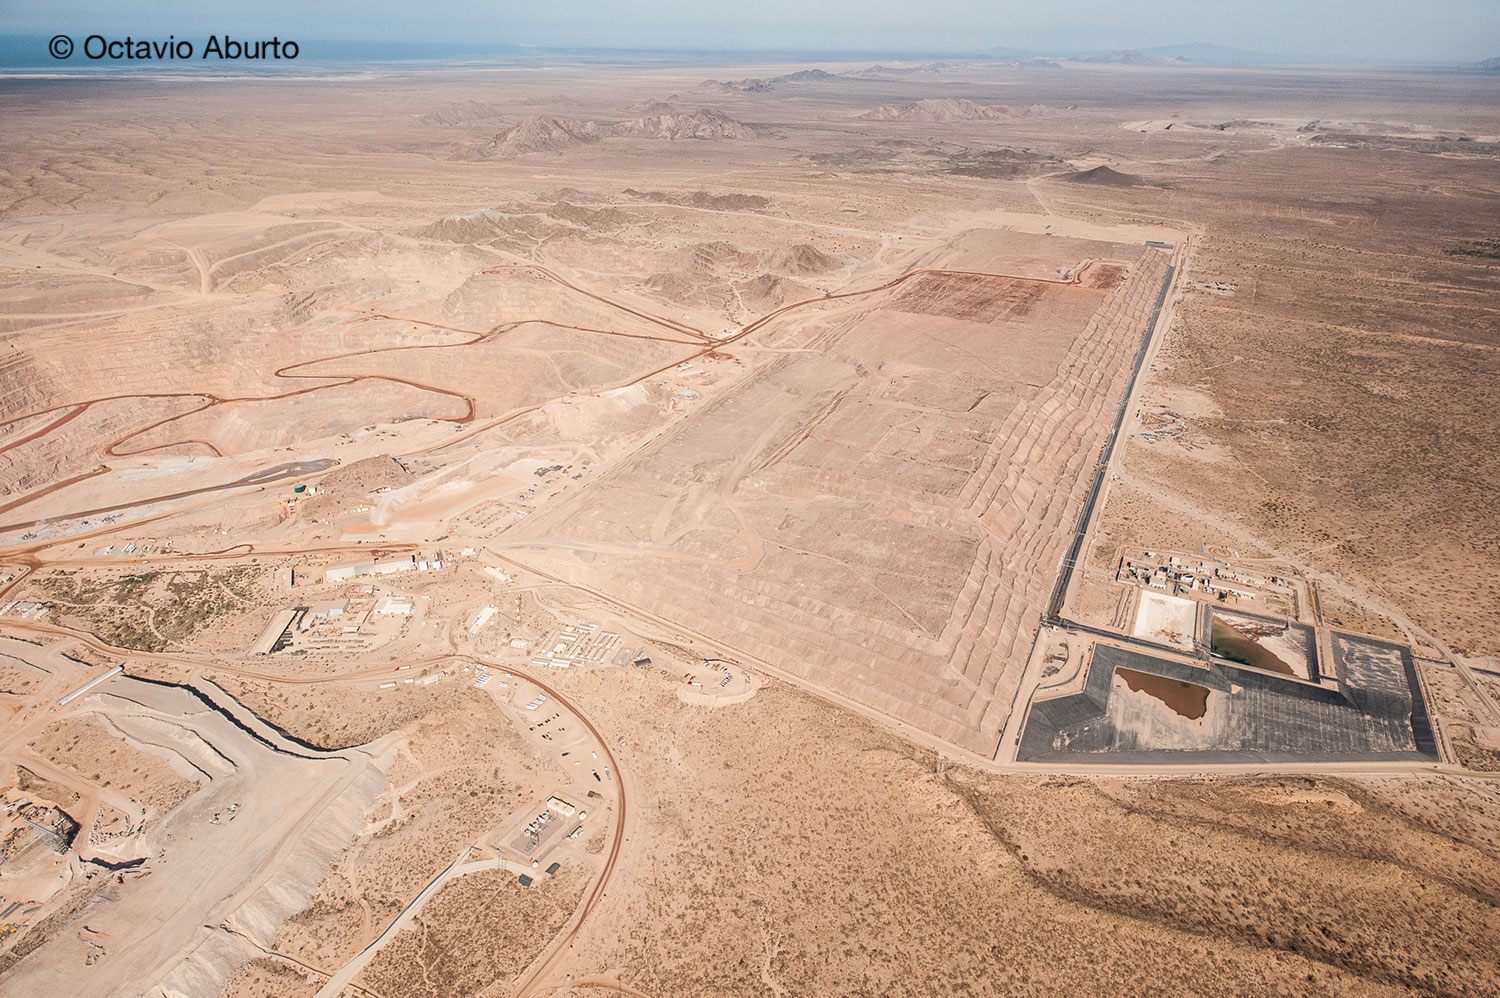
Developed countries should make concerted efforts to reduce current industrial practices (e.g. oil use) and the production of their by-products (e.g. carbon dioxide – CO2 and sulfur – SO2). Developing countries should reduce land destruction, particularly of habitats with significant climate change buffering capacity (e.g. mangroves and terrestrial forests), whilst increasing wastewater treatment. Global goals shared between the majority of the countries are reductions in overfishing, a resource extraction that often crosses political boundaries and market divisions; and the use of fertilizers, a global problem related to an ever-growing population and industrialization of food production.
Authors:
Octavio Aburto-Oropeza* and Andrew F. Johnson*
Contact Information:
DOI:
10.13022/M3T59Z
Affiliations:
*Scripps Institution of Oceanography, La Jolla, CA, USA.
Acknowledgements:
N/A
How to cite this story:
Octavio Aburto-Oropeza and Andrew F. Johnson (2016): Climate and environmental impacts at a global scale. DataMares. InteractiveResource. http://dx.doi.org/10.13022/M3T59Z
References
- Crutzen, P. J. & Steffen, W. How long have we been in the Anthropocene era. Climate Change 61, 251–257 (2003).
- Steffen, W. et al. Sustainability. Planetary boundaries: guiding human development on a changing planet. Science 347, 1259855–1259855 (2015).
Data sources:
The following links relate with the data for the different climate, environmental impacts:
- Overfishing (http://epi.yale.edu/content/fisheries-raw-data-file)
- Trawl fisheries (http://epi.yale.edu/content/fisheries-raw-data-file)
- Percentage of Mangrove change (https://dataverse.harvard.edu/dataset.xhtml?persistentId=doi:10.7910/DVN/HS5OXF)
- Marine protected areas (MPAs) (http://data.worldbank.org/indicator/ER.MRN.PTMR.ZS)
- Fertilizer use (http://data.worldbank.org/indicator/AG.CON.FERT.ZS)
- Mining mineral (http://data.worldbank.org/indicator/NY.GDP.MINR.RT.ZS)
- Oil use per capita (https://docs.google.com/spreadsheets/d/1XitcqqJtnu7cv1Nr0u131WCW8qTYHBkcD-JGiR7fmFM/pub?gid=0)
- Coal use per person (https://docs.google.com/spreadsheets/d/1QYrG4fkfJy8VeSm-wAdPQk6hxdGUk91QZPJLdjkjmh8/pub?gid=0)
- Terrestrial Biomes (http://epi.yale.edu/epi/issue-ranking/biodiversity-and-habitat)
- Forest area (http://data.worldbank.org/indicator/AG.LND.FRST.ZS)
- Wastewater Treatment (http://epi.yale.edu/content/water-resources-raw-data-file)
- Sulfur emission per person (https://docs.google.com/spreadsheets/d/1wnhRtOy-WB5g8LRv5cpuWg3q268ahuEJTHvxt9VfvLM/pub?gid=0)
- CO2 emissions (https://docs.google.com/spreadsheets/d/1RjqGm7RG82GGVf7E4RXPPwFF7O1So6T0SFx2fVfcUJA/pub?gid=0)