

Supplying the marine food requirements for an increasing human population.
The global human population has grown from around 2.5B in 1950, to 7.1B in 2013; a growth rate of almost 2% every year. According to United Nation projections, by 2050 the number will be approximately 9.3B. With this population growth comes a necessity to increase both food and livestock production to feed the planet’s growing number of mouths [1].
Fish consumption represents an important percentage of protein intake and general food supply, particularly for developing nations. From 1973 to 1997, the fish per capita consumption followed different trends for developed and developing countries. While for developed countries it decreased from 22.6 kg/yr to 21.7 kg/yr, in developing countries it almost doubled from 7.3 kg/yr to 14.0 kg/yr, resulting in a global increase from 10.1 kg/yr to 17.5 kg/yr [2]. But why is fish consumption per capita increasing?
According to FAO [3], aquaculture has played a major role in the last 40 years, with an average annual increase of 8% [1], a rate that exceeds human population growth. During the same period of time, great efforts to improve the condition of wild fish stocks have been made, but with relatively low success. The general increase in fisheries, plus aquaculture production and the improvement in the distribution channels of these products, has led to an increase in the average consumption per capita [3]
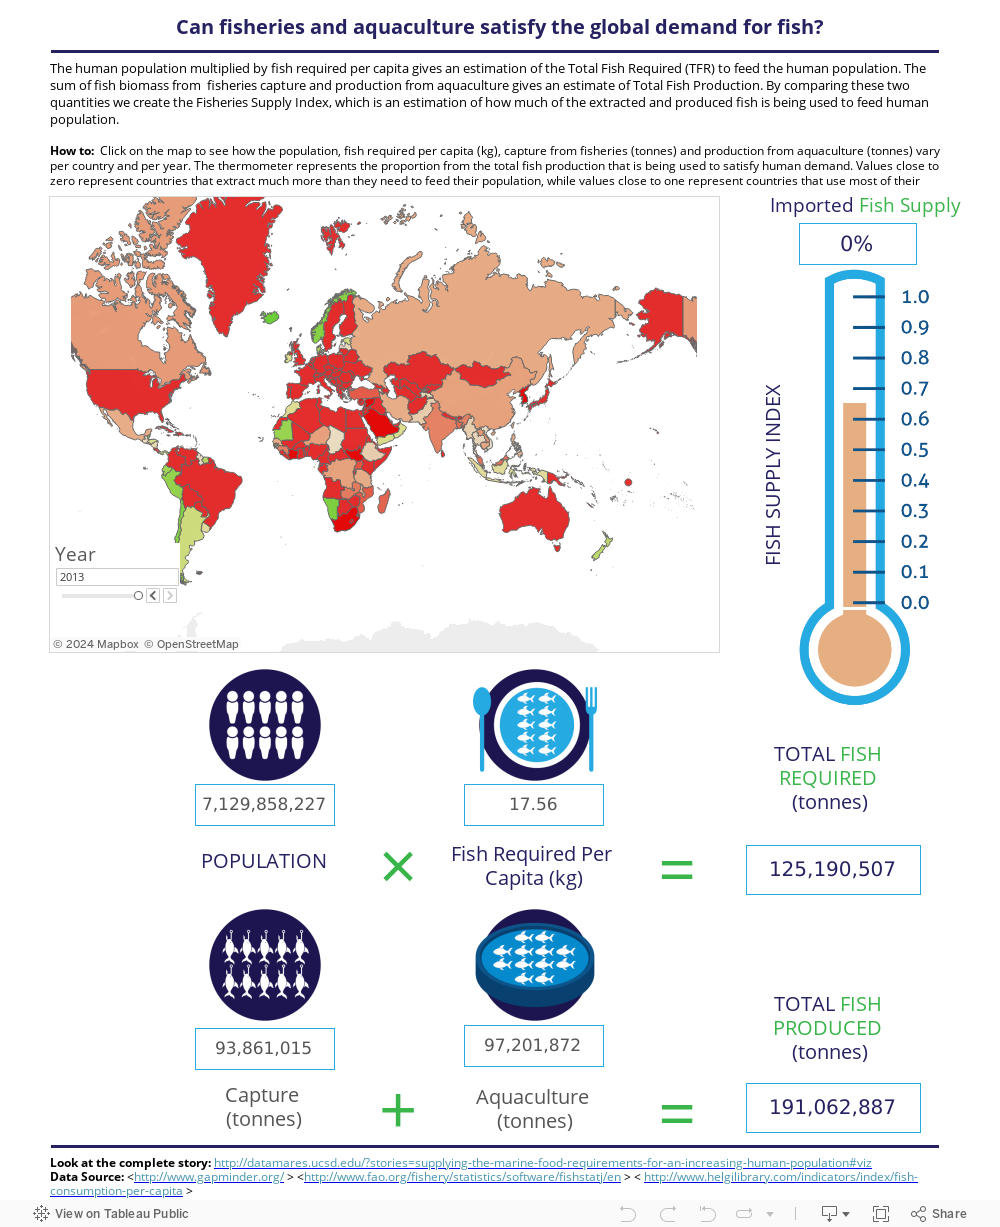
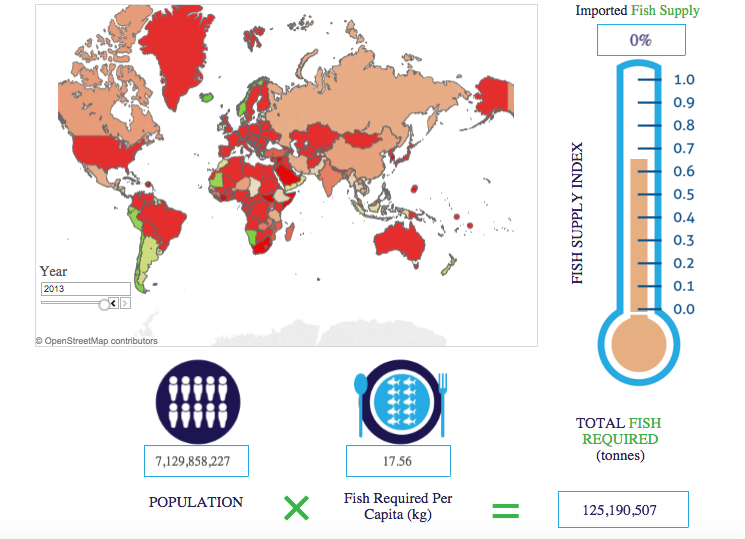
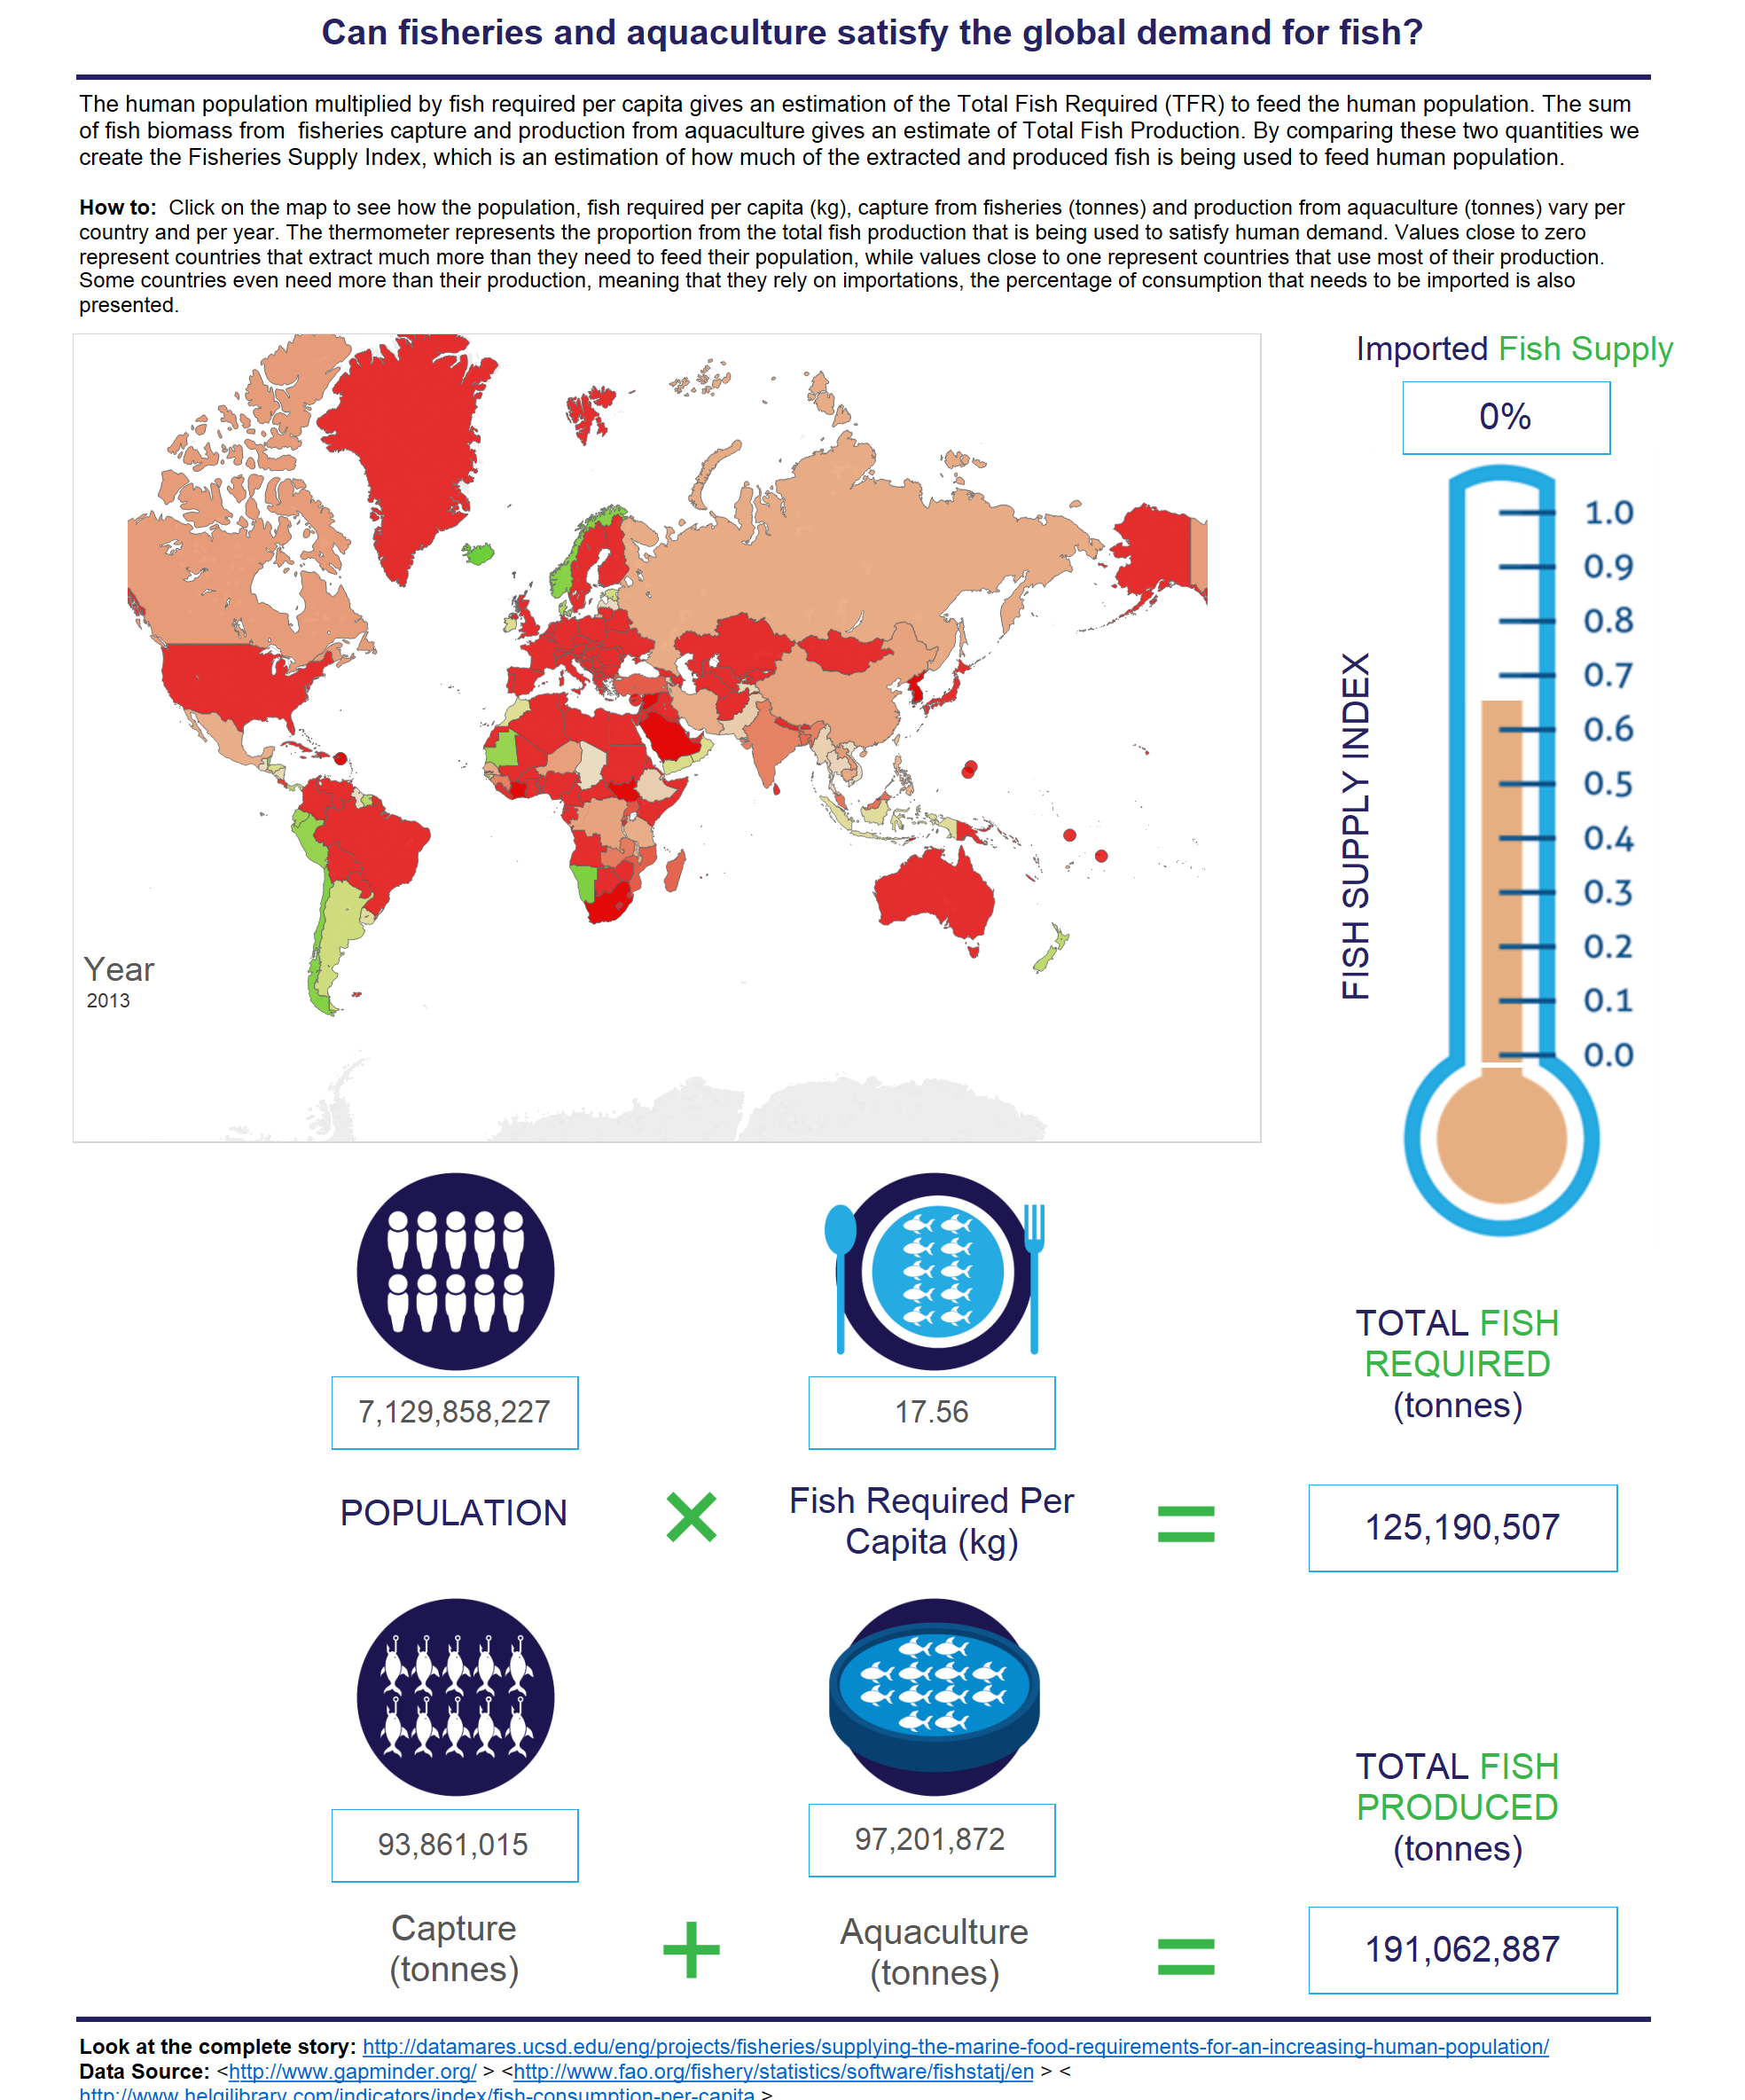
Here, we gather a series of worldwide databases to answer two main questions: How do fisheries and aquaculture production compare to the Total Fish Required to feed the world’s human population? And what is the trend for different countries? Considering the values of fish consumption per capita per year and human population, we calculated the Total Fish Required for each country from 1950 to 2013. We then compared this value with the total production from fisheries and aquaculture. In order to present the results, we considered a scale from 0 to 1 (thermometer for used production), where 0 represents a very low use of the extracted resources and 1 represents a complete use of all resources. Some countries will show that they require more fish than they can produce, therefore they rely on imports to satisfy their population requirements.
The results presented here are thought to be conservative in terms of fisheries captures, as they do not account for illegal and unreported catch. The values for utilized total production would be lower if this data were considered.
Major Findings
In the early 1950’s, the Total Fish Required (TFR) for the whole planet was barely satisfied by global fisheries. In 2013, the percentage of TFR was satisfied by 61% of the total catch plus aquaculture production; this means that in 2013 we were fishing much more than we needed to. On closer inspection, only 43% of the world countries can supply enough fish to fulfil their TFR, while the other 57% requires much more and relies on imports from other countries.
Authors:
Alfredo Girón-Nava*, Octavio Aburto-Oropeza*
Contact Information:
DOI:
10.13022/M3C30T
Affiliations:
*Scripps Institution of Oceanography, La Jolla, CA, USA
Acknowledgements:
We thank the Gapminder project for the data regarding human population and the FAO for compiling and providing high quality open access data for global fisheries. We are grateful to the David and Lucile Packard Foundation, the Walton Family Foundation, and the Helmsley Charitable Trust for supporting the creation of dataMares.
How to cite this story:
Alfredo Giron-Nava, Octavio Aburto-Oropeza (2015): Supplying the marine food requirements for an increasing human population. DataMares. InteractiveResource. http://dx.doi.org/10.13022/M3C30T
References
- Merino G, Barange M, Blanchard JL, Harle J, Holmes R, Allen I, et al. Can marine fisheries and aquaculture meet fish demand from a growing human population in a changing climate? Glob Environ Chang. Elsevier Ltd; 2012;22: 795–806. doi:10.1016/j.gloenvcha.2012.03.003
- Delgado CL, Wada N, Rosegrant MW, Meijer S, Ahmed M. Fish to 2020: supply and demand in changing global markets [Internet]. Working Papers. 2003. Available: http://ideas.repec.org/b/wfi/wfbook/15796.html
- Fao. The state of world fisheries and aquaculture [Internet]. Food and Agriculture Oraganization of the United Nations. 2014. doi:92-5-105177-1
- Swartz W, Sala E, Tracey S, Watson R, Pauly D. The spatial expansion and ecological footprint of fisheries (1950 to present). PLoS One. 2010;5: e15143. doi:10.1371/journal.pone.0015143